Good afternoon folks,
Although we had a short week, it was filled with opportunities, both long and short. We opened Tuesday at 4512 and hit a low of 4430 on Thursday. We had three days of straight red. We managed to recover by Thursday’s close, which was 24 points higher at 4454. On Friday, we continued this bounce, closing at 4465.
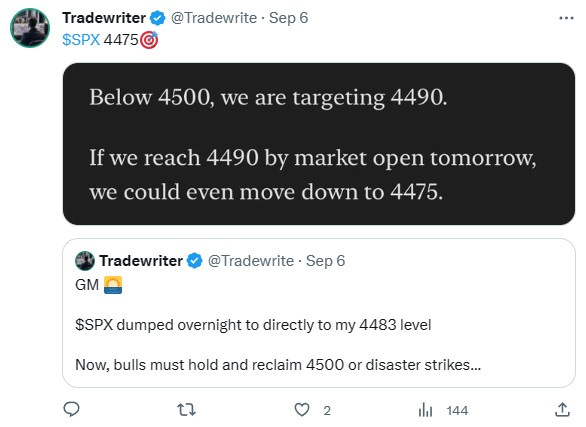
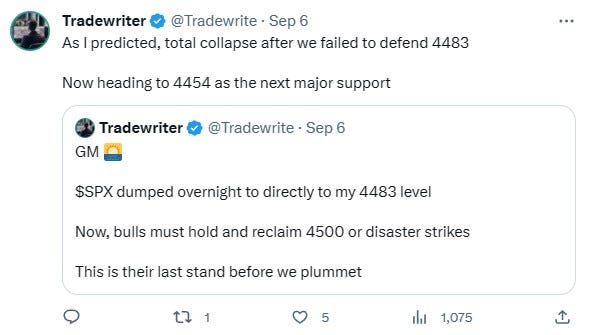
We had an explosive week where we were able to capture hundreds of points from following our daily plan and levels. Here’s a recap:
Outlook for Next Week
I trade the S&P 500 index daily and use supply/demand levels as my main strategy. I focus on a handful of core setups within these levels (found here) which typically appear 1-3 times a day. I take one or two trades a day, targeting gains of 10-30 points. My objective is to maintain consistency and leverage it, rather than trying to get as many points as possible.
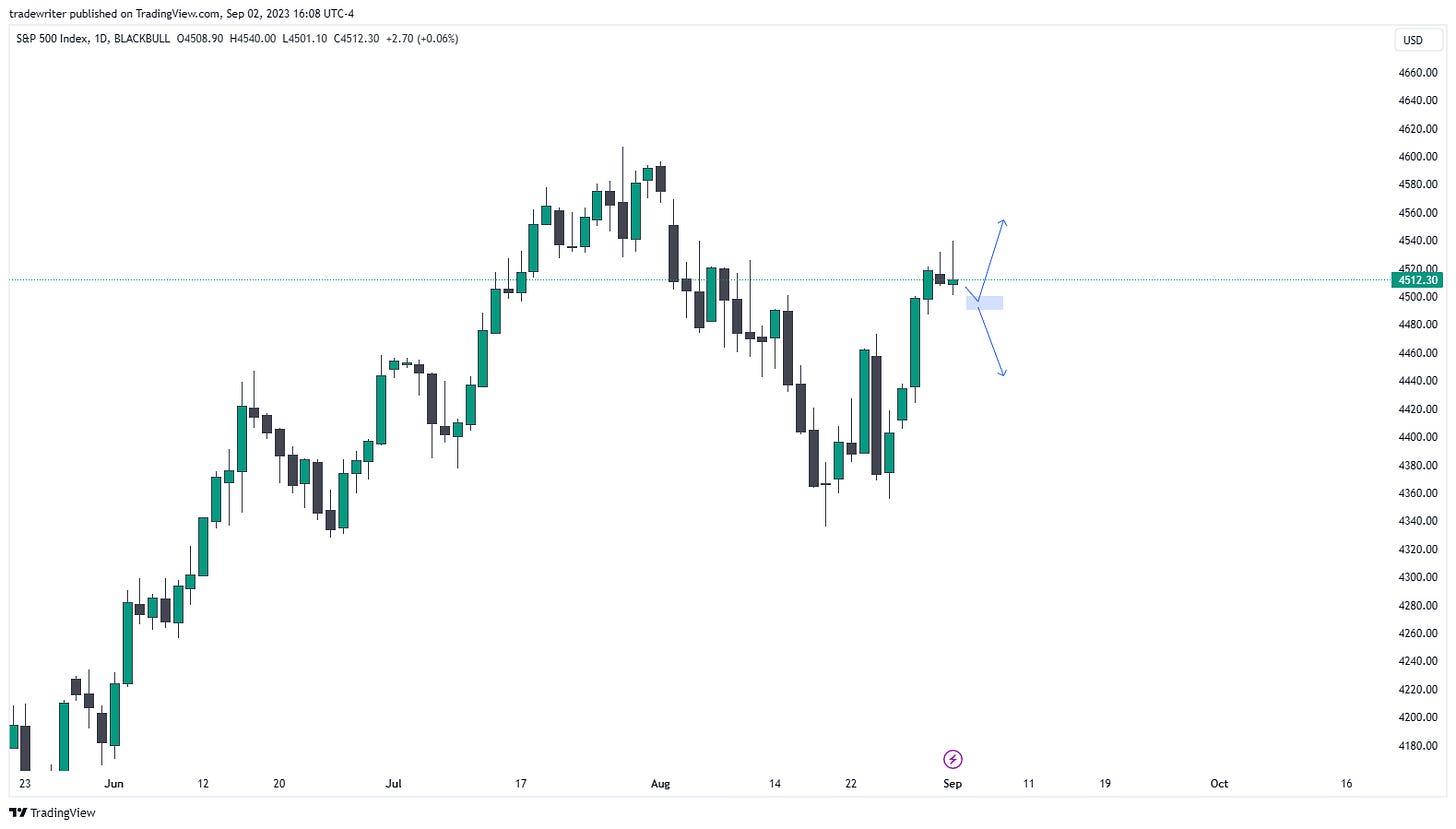
Here’s last week’s projection:
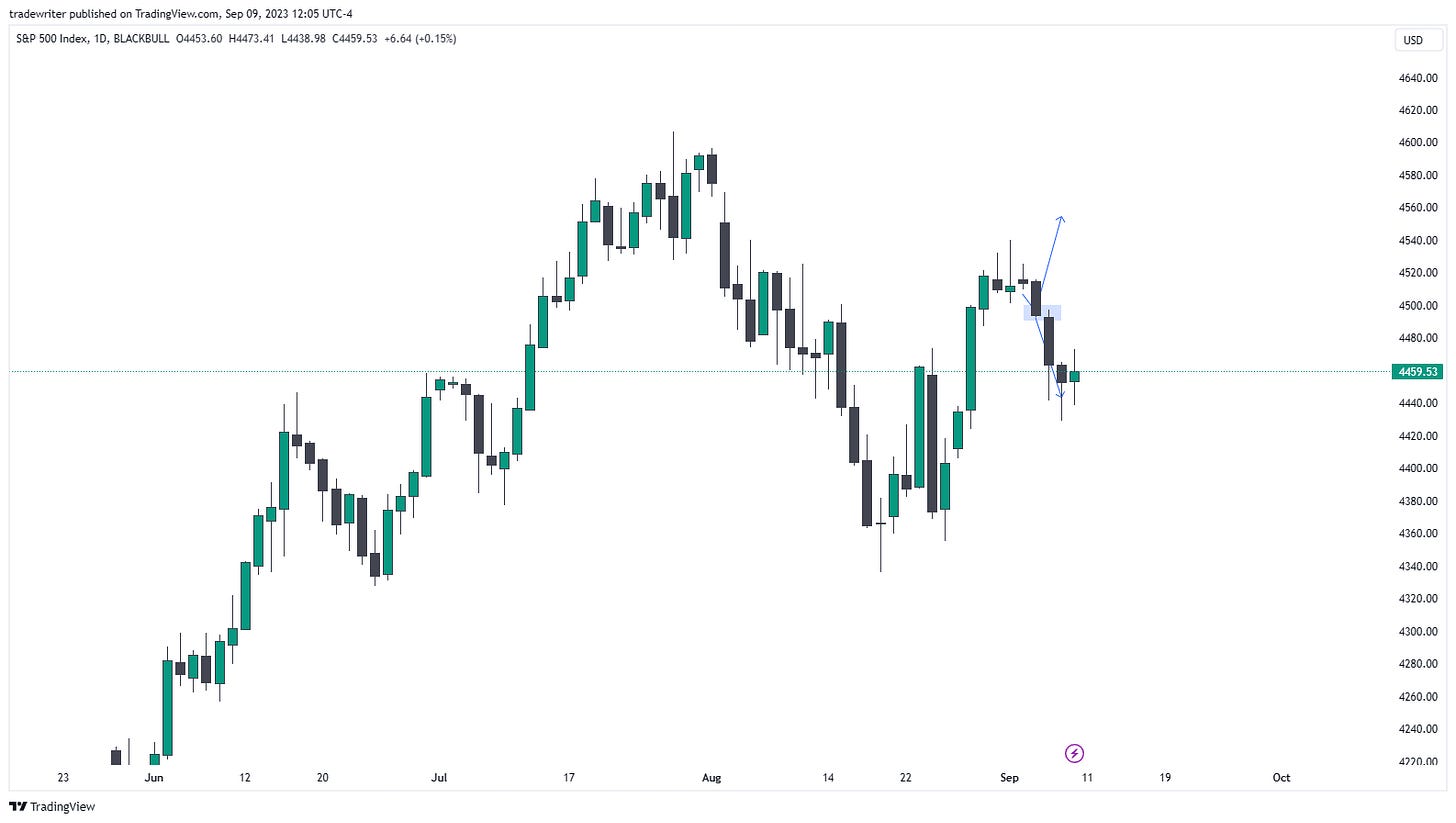
Here’s this week’s results:
Notice how critical the 4500 level was during the week. I also stated:
I’ll be focusing on the 4500 level, and how well it holds this week. If it holds, this rally continues for another 40-50 points at least..If it breaks, we might be looking at a steep decline of 60-100 points
We ended up dropping 70 points after it broke.
We dumped heavily this week, even though it was a short one. We began showing signs of recovery on Friday. This week, we’ll be focusing on whether this recovery continues or fails. So far, seasonality has been following well. We’ve started the month with a dump, which is typical of early September.
The key level for next week is 4480. Bulls want to break above this level to resume the long-term uptrend and rally another 50-80 points. Bears want this level to hold so they can keep declining lower to the 4300’s.
Since we day trade, we don’t have a weekly bias. We reset it every day. We will trade whatever setup presents itself, bear or bull. Trade setups, projections, and intraday levels are found on the paid substack, as well as supply/demand education so you can trade self-sufficiently (subscribe button below).
Chart:
This is not a prediction, just a general outlook of where price action goes next. That’s this week’s outlook. Good luck :)
- Tradewriter
Disclaimer: Investing in stocks, bonds, futures, options, and other securities carries significant risks. Some or all capital may be lost. With leveraged instruments, losses may exceed initial capital. Past performance of a security does not guarantee future results. Any content from this newsletter should not be taken as financial or investment advice, but for informational and entertainment purposes only. This newsletter simply shares my personal opinions and notes. Consult with a registered financial/investment professional. This newsletter and its authors are not licensed financial/investment professionals. By reading and using this newsletter, as well as any other publications, you are agreeing to these terms.


Hi so one would wait for 4480 and watch price action there to decide if short or continuation up is in play? Thanks
Correct. Doesn’t mean we can trade the levels in between though